
Why benchmark investment returns?
Benchmarking investment returns means comparing your portfolio's performance against a relevant market index or standard, giving you an objective frame of reference rather than just a raw number. Without that context, a 7% annual return could look impressive or disappointing depending entirely on what the broader market delivered over the same period.
The core reasons to benchmark are practical and immediate:
- Performance context: A return figure alone tells you nothing. Measured against the FTSE 100 or FTSE All-Share Index, it tells you whether your strategy is adding value or simply riding market momentum.
- Risk alignment: Benchmarks provide a framework for both risk and return management, helping you assess whether your portfolio's volatility is proportionate to its gains.
- Active management accountability: Benchmarks reveal whether a fund manager genuinely adds value or whether a low-cost index tracker would serve you better.
- Realistic expectations: Comparing returns over a full market cycle prevents you from drawing conclusions based on a single strong or weak quarter.
- Strategic adjustments: Consistent underperformance relative to a representative benchmark signals a need to re-evaluate strategy, costs, or both.
In the UK context, the FTSE 100 (the 100 largest companies listed on the London Stock Exchange) is the most widely recognised equity benchmark, though it covers only a slice of the market. Broader indices and fixed income standards like UK Gilts round out the picture for diversified portfolios.
What is a benchmark and which UK market indexes matter?
A benchmark is a reference portfolio against which investment performance is measured. In its simplest form, it is a market index that tracks a defined set of securities on a buy-and-hold basis. Investors cannot invest directly in an index, but they can use one to judge whether their own portfolio is keeping pace, lagging, or genuinely outperforming.
The major UK-relevant benchmarks span equities and fixed income:
- FTSE 100: Tracks the 100 largest companies by market capitalisation on the London Stock Exchange. It is the headline UK equity benchmark, though its heavy weighting towards energy, mining, and financial stocks means it does not represent the full UK economy.
- FTSE All-Share Index: Covers approximately 600 companies across large, mid, and small caps listed in the UK, offering a far broader picture of domestic equity performance.
- MSCI UK Index: Measures the performance of large and mid-cap UK equities and is widely used by institutional investors and global fund managers as a standard for UK equity exposure.
- UK Gilts: Government bonds issued by HM Treasury, serving as the standard fixed income benchmark for sterling bond portfolios. They also represent the closest proxy to a risk-free rate for UK investors.
| Index | Asset class | Coverage |
|---|---|---|
| FTSE 100 | UK large-cap equities | 100 companies, London Stock Exchange |
| FTSE All-Share | Broad UK equities | ~600 companies, large/mid/small cap |
| MSCI UK Index | UK large and mid-cap equities | Institutional standard for UK equity |
| UK Gilts | Fixed income | UK government bonds, sterling denominated |
Beyond these, sector-specific and asset-class benchmarks exist for property, commodities, and alternatives. The right choice depends on what your portfolio actually holds, not on which index sounds most familiar.
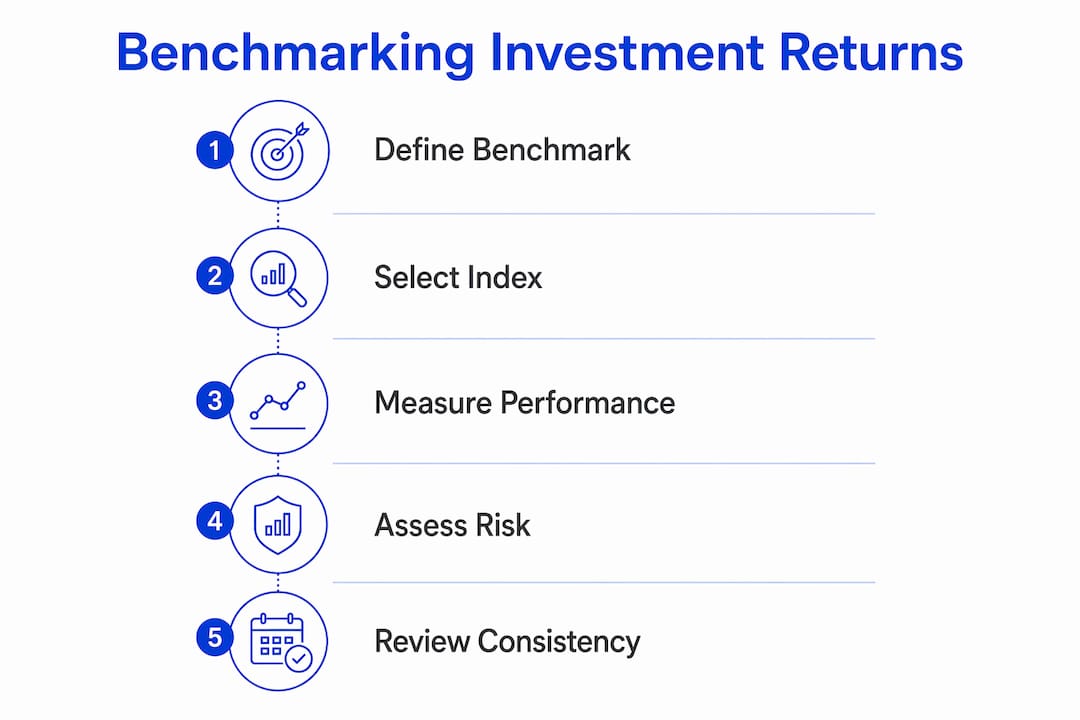
How benchmarks help you track portfolio performance
Comparing your portfolio's returns to a benchmark is only the starting point. The more telling analysis comes from risk-adjusted measures that reveal whether you are being adequately compensated for the volatility you are accepting.
Three metrics do most of the work here:
- Tracking error: The difference between a portfolio's returns and its benchmark, expressed as a standard deviation percentage. High tracking error signals active management and greater deviation from benchmark holdings, which can represent either opportunity or risk depending on the outcome.
- Beta: Measures a portfolio's sensitivity to benchmark movements. A beta below 1.0 indicates lower sensitivity to market swings; above 1.0 suggests the portfolio amplifies market moves in both directions.
- Sharpe ratio: Calculates risk-adjusted return by dividing excess returns (portfolio return minus benchmark return) by the standard deviation of those returns. A higher ratio means better return per unit of risk taken.
Key insight: Benchmarks allow investors to identify whether an active manager genuinely adds value or whether passive investing aligned with the benchmark would deliver better net results.
When an actively managed fund consistently posts positive tracking error, the manager is adding value above the index. Negative tracking error over multiple years, particularly after fees, is a clear signal to reassess. The Sharpe ratio adds another layer: a portfolio that outperforms its benchmark but does so by taking on disproportionate risk has not necessarily made a sound trade-off.

How to select the right benchmark for your portfolio
The benchmark you choose shapes every performance conclusion you draw. A benchmark that is too easy to beat inflates apparent performance; one misaligned with your strategy obscures whether genuine value is being added.
Practical criteria for selection:
- Representativeness: The benchmark should reflect the asset classes, geographies, and sectors your portfolio actually holds. A UK equity portfolio benchmarked against a global index will produce misleading comparisons.
- Risk profile match: Investors with lower risk tolerance should select benchmarks with shorter duration or higher credit quality. Matching risk profile prevents the benchmark from setting unrealistic return expectations.
- Liquidity: The benchmark's constituents should be investable. An index containing illiquid securities creates a comparison that cannot be replicated in practice.
- Independence from strategy: Choosing a benchmark after observing returns is a form of data mining. The benchmark must be defined before the measurement period begins, based on objective criteria.
- International and inflation considerations: If your portfolio holds international securities or inflation-linked instruments, your benchmark should reflect that. The Bloomberg UK Gilt Inflation-Linked Index, for instance, is appropriate for portfolios with real-return objectives.
Pro Tip: Define your benchmark before you start measuring performance, not after. Selecting a benchmark that makes your track record look favourable is one of the most common sources of misleading self-assessment in portfolio management.
For UK investors assessing investment risk, the risk-free rate represented by short-term UK Gilts serves as the minimum meaningful benchmark. If your strategy cannot beat the risk-free rate on a risk-adjusted basis over a full cycle, it is not generating value for the risk you are taking on.
How index construction methodology affects your benchmarking results
Not all benchmarks are built the same way, and the methodology behind an index directly affects how you interpret your portfolio's performance against it.
- Market-cap weighted indexes (such as the FTSE 100 and MSCI UK Index) give larger companies a proportionally greater influence on index returns. This means a handful of mega-cap stocks can dominate performance, and your portfolio's alpha or beta readings will reflect that concentration.
- Equal-weighted indexes assign the same weight to every constituent regardless of size, producing different return profiles and typically higher turnover as the index rebalances to maintain equal weights.
- Factor-based (smart beta) indexes weight constituents by characteristics such as value, momentum, or low volatility rather than market cap. Comparing a factor-tilted portfolio against a market-cap index will produce misleading alpha readings because the two are not measuring the same thing.
Differences in index construction affect measured portfolio alpha, beta, and tracking error, which in turn affects how you evaluate active management. A portfolio that appears to have positive alpha against one index may show negative alpha against another, so the benchmark is never a neutral choice.
Index rebalancing also matters. When an index's constituents change, active managers incur trading costs to replicate those changes, while the index itself does not. This creates a structural drag that shows up in tracking error and makes it harder to match index returns precisely in practice.
Common misconceptions and best practices in benchmarking
The most persistent misconception is that the goal of benchmarking is always to beat the benchmark. It is not. The primary purpose is transparency: understanding whether your portfolio is delivering returns appropriate to its risk level and cost structure.
- Misconception 1: Short-term comparisons are meaningful. FINRA recommends long-term benchmark comparisons over several years rather than quarterly or single-year snapshots. Short-term comparisons are easily distorted by one-off market events.
- Misconception 2: Outperforming the benchmark gross of fees is enough. A fund with 1.5% annual expenses must outperform its benchmark by that margin before fees just to break even on net return. Performance comparisons should always be net of fees, because fee drag compounds significantly over time.
- Misconception 3: Any benchmark will do. An inappropriate benchmark can make a weak strategy appear strong or penalise a well-structured one unfairly. The benchmark must genuinely represent the investment universe your portfolio operates in.
- Misconception 4: Underperforming the benchmark always means failure. If a portfolio underperforms its benchmark but does so because it takes on less risk, it may still be a good fit for a conservative investor's objectives.
Best practice: Evaluate performance over a full market cycle of several years to avoid reactive decisions driven by short-term volatility. Predefined benchmarks, risk-adjusted comparisons, and net-of-fee analysis are the three pillars of meaningful benchmarking.
For investors exploring whether index funds suit their strategy, consistent underperformance relative to an appropriate benchmark is often the clearest signal that a passive approach would deliver better net results.
How to interpret benchmarking results and act on them
Raw outperformance or underperformance is only the first data point. Interpreting benchmarking results well means asking why the gap exists, not just whether it does.
Start with attribution. If your portfolio outperformed the FTSE All-Share by 3% last year, identify whether that came from asset selection, sector allocation, or simply holding a higher proportion of an asset class that happened to perform well. Outperformance driven by concentrated sector bets carries different implications than outperformance from consistent stock selection across a diversified portfolio.
Then consider risk. A portfolio that returned 12% against a benchmark of 10% looks attractive until you discover the portfolio's volatility was twice that of the benchmark. The Sharpe ratio resolves this by expressing return per unit of risk, giving you a cleaner comparison. If the risk-adjusted return does not justify the active management approach, the data is pointing you towards a lower-cost alternative.
Finally, look at consistency. A single year of outperformance is noise. Three to five years of consistent results across different market conditions, including downturns, is the kind of evidence that supports continuing with an active strategy. Anything less and you are drawing conclusions from too small a sample.
Benchmarking across asset classes: equities, bonds, and alternatives
The benchmarking logic is consistent across asset classes, but the specific indices and metrics shift depending on what you hold.

Equities: UK equity portfolios typically benchmark against the FTSE 100, FTSE All-Share, or MSCI UK Index depending on market-cap focus. For global equity exposure, the MSCI All Country World Index (ACWI) covers equities across 47 markets and is the standard for internationally diversified portfolios.
Bonds and fixed income: UK Gilts serve as the primary benchmark for sterling fixed income. For corporate bond exposure, indices tracking investment-grade or high-yield sterling bonds provide a more appropriate comparison than government bonds alone. Inflation-linked portfolios use indices such as the Bloomberg UK Gilt Inflation-Linked Index to measure real returns against inflation-adjusted liabilities.
Alternatives: Property portfolios often benchmark against real estate investment trust (REIT) indices. Commodities exposure is typically measured against broad commodity indices. For multi-asset or absolute return strategies, the risk-free rate (short-term UK Gilts) is often the most honest benchmark, since these strategies explicitly aim to generate positive returns regardless of market direction.
The key principle across all asset classes is the same: the benchmark must reflect what the portfolio actually holds. Benchmarking a bond-heavy portfolio against an equity index produces a comparison that serves no analytical purpose.
How benchmarking supports regulatory compliance in the UK
UK regulatory requirements make benchmarking a formal obligation for many fund managers, not just a best practice. The Financial Conduct Authority (FCA) requires authorised funds to disclose performance against an appropriate benchmark in their Key Investor Information Documents (KIIDs) and ongoing charges disclosures, giving retail investors a standardised basis for comparison.
For discretionary portfolio managers operating under FCA authorisation, MiFID II-derived rules require periodic performance reporting that includes benchmark comparisons. This means the benchmark is not just an internal management tool but a disclosed, auditable reference point that clients can use to hold managers accountable.
Benchmarking also supports Treating Customers Fairly (TCF) obligations. A manager who consistently underperforms a relevant benchmark without adequate justification faces scrutiny over whether the service delivered represents fair value. The FCA's asset management market study highlighted benchmark-relative performance as a central metric for assessing value for money in actively managed funds.
For individual investors tracking investment performance over time, maintaining clear benchmark records supports tax reporting, particularly when calculating gains relative to market conditions for Capital Gains Tax purposes. It also provides the documentation needed for any formal portfolio audit or adviser review.
Key takeaways
Benchmarking investment returns is the most reliable way to assess whether your portfolio is delivering value relative to its risk level, costs, and the broader market.
| Point | Details |
|---|---|
| Define benchmarks upfront | Set your benchmark before measuring performance to avoid biased or misleading self-assessment. |
| Match benchmark to portfolio | Use the FTSE All-Share, MSCI UK Index, or UK Gilts depending on your actual asset allocation. |
| Account for fees | A fund must outperform its benchmark by at least its expense ratio to justify active management net of costs. |
| Evaluate over full market cycles | Short-term comparisons distort results; several years of data across different conditions is the meaningful standard. |
| Use risk-adjusted measures | Sharpe ratio and beta reveal whether outperformance reflects skill or simply higher risk-taking. |

