
Tracking investment performance is the process of systematically measuring how your investments grow or decline over time, accounting for returns, risks, fees, and cash flows to support informed decisions. Without this discipline, you cannot distinguish genuine portfolio growth from capital injections, or identify whether your returns justify the risks you are taking. Investors who monitor portfolio performance consistently make faster, more confident decisions and avoid the silent wealth erosion that catches most people off guard. Understanding the importance of tracking investments is not optional for anyone serious about building long-term wealth. Crowdinform aggregates data from over 500 European crowdfunding platforms precisely because accurate, consolidated performance data is what separates successful investors from those flying blind.
Why track investment performance: the core case
Tracking investment performance gives you an accurate picture of your portfolio's true value, not just its face value. A portfolio that appears to have grown by 15% may have received 10% of that from new deposits. Without a time-series view that separates gains from capital injections, you are measuring the wrong thing entirely.
The standard industry term for this discipline is portfolio performance measurement, and it draws on recognised metrics including absolute return, relative return, and risk-adjusted return. Regulatory bodies such as FINRA expect professional managers to report performance using these standards. Individual investors benefit from applying the same rigour to their own portfolios.

Dividends alone illustrate the stakes. Dividends have contributed approximately 40% of the total return of the S&P 500 historically. Investors who do not track reinvested dividends are missing nearly half of their compounding engine.
What does tracking investment performance involve?
Effective tracking goes well beyond watching a number on a screen. You need to monitor several layers of your portfolio simultaneously.
The key metrics to track include:
- Absolute return: the raw percentage gain or loss on your portfolio over a period
- Relative return: your return compared to a relevant benchmark, such as the FTSE All-World Index
- Volatility: how much your portfolio fluctuates, expressed as standard deviation
- Maximum drawdown: the largest peak-to-trough decline, which reveals your real downside exposure
- Sharpe ratio: return per unit of risk, the most widely used risk-adjusted measure
- Net worth and asset allocation: the four core metrics of net worth, asset allocation, debt-to-asset ratio, and liquidity provide a complete financial health overview
You also need to account for fees, taxes, and currency effects. A portfolio holding European, US, and Asian assets will show different nominal and real returns depending on exchange rate movements. Currency fluctuations can swing real returns by double digits annually, which makes currency drag a critical factor for any investor with international exposure.
Pro Tip: Broker "total return" figures often exclude cash flows, deposits, and tax drag. Always use a time-weighted return (TWR) calculation to isolate your actual investment skill from the effect of adding or withdrawing money.
How can failing to track performance properly impact long-term wealth?
Poor tracking is not a minor inconvenience. It is a wealth destruction mechanism that operates silently over decades.
A 1% annual tracking error compounded over 20 years on a £100,000 portfolio produces a discrepancy of over £20,000. That gap represents real money you either thought you had or thought you had earned. The error compounds because each year's miscalculation feeds into the next.
Fees work the same way. A 1% annual fee on a £100,000 portfolio costs approximately £30,000 over 20 years when you factor in both direct charges and lost compounding potential. Most investors who do not track fees closely have no idea this erosion is happening. They see a growing balance and assume all is well.
The most common hidden costs that poor tracking misses:
- Reinvested dividends not recorded, understating total return
- Platform and fund management fees not consolidated across accounts
- Currency conversion costs on international holdings
- Tax drag from inefficient disposal of assets
- Cash drag from uninvested balances sitting idle
Broker-reported return figures frequently exclude these factors. Relying on them leads to misleading conclusions about how well your portfolio is actually performing. Tracking common errors in your investment process, including over-reliance on incomplete data, is a discipline in itself. Guides on tracking trading mistakes highlight how systematic review prevents the same costly errors from repeating.
What are the behavioural benefits of consistent performance tracking?
Tracking does not just improve your numbers. It changes how you behave as an investor, and that matters enormously.
Tracking reduces emotion-driven trades by providing factual context during market volatility. When you can see that your portfolio is down 8% but your benchmark is down 12%, you have a reason to hold rather than panic-sell. Without that context, fear fills the gap. The relationship between tracking and trading psychology is direct: investors who see their data clearly make calmer, better-timed decisions.
Four behavioural improvements that consistent tracking produces:
- Reduced impulsive trading: factual data replaces gut reactions during drawdowns
- Disciplined rebalancing: you can see when asset allocation has drifted and act on evidence, not instinct
- Goal alignment: visible progress towards a specific target keeps you invested through short-term noise
- Faster decisions: when you already know your risk exposure and liquidity position, you act quickly and confidently
The time commitment is smaller than most investors expect. Fifteen minutes per month focused on net worth, asset allocation, debt-to-asset ratio, and liquidity is sufficient to maintain an effective tracking system. The barrier is not time. It is having the right structure in place.
Pro Tip: Set a fixed monthly review date, such as the first Sunday of each month. Consistency matters more than frequency. Investors who review quarterly with discipline outperform those who check daily without a framework.
What are effective methods and tools for tracking investment performance?
The method you choose shapes the quality of the insight you get. Two calculations form the foundation of any serious tracking system.
Time-weighted return (TWR) measures portfolio performance independent of cash flows. It is the standard used by professional fund managers and removes the distortion caused by deposits and withdrawals. Internal rate of return (IRR) measures the actual return on your personal cash invested, accounting for the timing of each contribution. Both are useful. TWR tells you how good your investment choices were. IRR tells you how good your timing was.
Manual tracking in a spreadsheet works for simple portfolios with one or two accounts. It breaks down quickly when you hold assets across multiple platforms, currencies, and asset classes. Automated dashboards that pull data from multiple sources give you a consolidated view without the reconciliation burden.
| Tracking approach | Best suited for | Key limitation |
|---|---|---|
| Spreadsheet (manual) | Single account, simple assets | No automation, error-prone at scale |
| Broker dashboard | Assets on one platform only | Excludes off-platform holdings |
| Consolidated portfolio tool | Multi-platform, multi-asset investors | Requires data integration setup |
| AI-assisted analysis | Complex portfolios needing pattern insight | Dependent on data quality fed in |
Tax lot tracking deserves special attention. Maintaining separate tax lots enables you to choose which specific units to sell, minimising capital gains tax liabilities. This is one of the highest-value features of advanced tracking systems and one of the most overlooked by individual investors.
For investors in European crowdfunding and alternative assets, analysing investment platforms before committing capital is the first step. Tracking performance after entry is the second. Both are non-negotiable.
How to interpret tracked performance data to improve your portfolio
Raw data without interpretation is just noise. The goal is to extract decisions from what you track.
Performance monitoring must consider how returns were generated, not just the headline figure. A 12% return in a year when your benchmark returned 18% is underperformance, not success. Comparing your returns against a relevant benchmark is the only way to assess whether your active decisions added value or destroyed it.
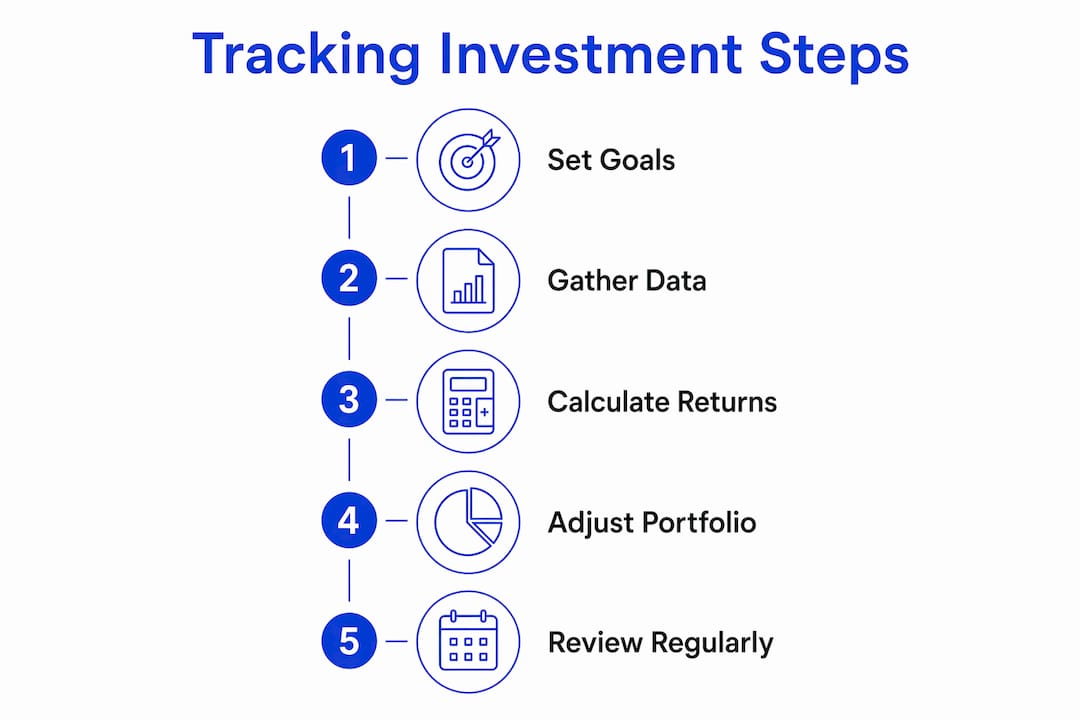
Five interpretive steps that turn tracked data into portfolio improvements:
- Benchmark comparison: measure your return against the FTSE All-World, MSCI Europe, or a relevant sector index to assess relative skill
- Volatility assessment: if your return matches the benchmark but your volatility is higher, you are taking excess risk for no reward
- Fee audit: calculate total annual cost across all platforms and funds; anything above 1% warrants scrutiny
- Currency review: separate local currency returns from sterling-adjusted returns to understand true purchasing power gains
- Tax lot analysis: identify positions with large unrealised gains and plan disposals across tax years to reduce liability
Smart investing requires this level of analysis. Investors who treat their portfolio as a single number rather than a set of interacting components consistently leave returns on the table. Diversification amplifies the need for detailed tracking because each asset class behaves differently across market cycles.
Key takeaways
Tracking investment performance is the single most effective habit for protecting and growing long-term wealth, because it reveals hidden costs, behavioural risks, and genuine returns that headline figures conceal.
| Point | Details |
|---|---|
| Separate gains from deposits | Use time-weighted return to isolate investment skill from cash flow effects. |
| Hidden costs compound heavily | A 1% annual fee costs approximately £30,000 over 20 years on a £100,000 portfolio. |
| Dividends drive total return | Dividends account for roughly 40% of S&P 500 total returns; not tracking them distorts your picture. |
| Tracking reduces emotional trading | Factual data during volatility prevents impulsive decisions that destroy long-term returns. |
| Tax lot tracking saves money | Identifying specific lots for disposal minimises capital gains tax across tax years. |
Why I think most investors are tracking the wrong thing
I have reviewed hundreds of investor portfolios through my work with Crowdinform, and the pattern is consistent. Investors check their balance. They do not check their return. Those are not the same number, and the gap between them is where wealth quietly disappears.
The most common mistake I see is trusting the figure a broker shows as "total return." That number almost never accounts for the timing of deposits, the drag of fees, or the effect of currency movements on international holdings. Investors feel confident because the number is positive. They have no idea they are underperforming a simple index fund by 4% a year.
The behavioural side is equally underestimated. Investors who track consistently do not panic-sell in drawdowns at anything like the rate of those who do not. Seeing your portfolio down 10% in context, knowing your benchmark is down 14% and your long-term annualised return is still 7%, is genuinely calming. That calm is worth more than any single investment decision.
Technology has made this far more accessible than it was even five years ago. AI-assisted tools can now flag fee drag, currency exposure, and benchmark deviation automatically. The barrier is no longer capability. It is the willingness to look honestly at the numbers. My advice: set up your tracking system before you need it. The worst time to build a dashboard is during a market correction when you are already anxious.
— Jevgenijs
Crowdinform: your platform for smarter investment insight
Crowdinform gives European investors a consolidated view of crowdfunding and alternative investment opportunities across more than 500 platforms.
The platform aggregates project data, user reviews, and AI-powered analysis so you can assess performance, compare platforms, and make evidence-based decisions without spending hours on manual research. Whether you hold P2P loans, real estate crowdfunding, or startup equity, Crowdinform brings your investment intelligence into one place. The built-in AI copilot reviews individual projects and surfaces the metrics that matter most for your goals. Explore Crowdinform and see how consolidated investment data changes the quality of your decisions.
FAQ
Why is tracking investment performance important?
Tracking investment performance reveals your true returns after fees, taxes, and currency effects, which headline figures consistently obscure. Without it, you cannot distinguish genuine portfolio growth from capital injections or assess whether your decisions are adding value.
What is the difference between TWR and IRR?
Time-weighted return (TWR) measures how well your investments performed independent of cash flows, making it ideal for comparing against benchmarks. Internal rate of return (IRR) measures the return on your actual cash invested, accounting for the timing of each deposit or withdrawal.
How often should I review my investment portfolio?
Fifteen minutes per month focused on net worth, asset allocation, debt-to-asset ratio, and liquidity is sufficient for most individual investors. Consistency matters more than frequency.
What hidden costs does poor tracking miss?
Poor tracking typically misses reinvested dividends, platform fees, currency conversion costs, tax drag, and cash drag from uninvested balances. A 1% annual fee costs approximately £30,000 over 20 years on a £100,000 portfolio.
How do I use benchmarks to assess my portfolio?
Compare your portfolio return against a relevant index such as the FTSE All-World or MSCI Europe to determine whether your active decisions added or destroyed value. Returns must be evaluated against benchmarks and adjusted for risk to reveal true investment skill.


